Project management reporting can often feel like navigating a labyrinth, right? I’ve been there, staring at endless spreadsheets, trying to distill weeks of work into a concise and impactful update.
It’s a crucial skill, though, because effective reporting keeps stakeholders informed, aligns teams, and ultimately drives project success. Looking ahead, AI-powered tools promise to revolutionize how we create and interpret these reports, offering insights and automation we could only dream of a few years ago.
Personally, I’ve found that the key lies in blending data with storytelling – making those numbers resonate with the audience. Let’s dive deeper into the art of crafting insightful reports in the following content!
Crafting project management reports that actually get read and acted upon is a skill many PMs strive for. It’s about more than just listing tasks and deadlines; it’s about painting a picture of progress, challenges, and future directions.
Over the years, I’ve learned that a good report isn’t just informative—it’s engaging and tailored to its audience.
Tailoring Your Report to the Audience

Understanding who will be reading your report is paramount. Are they senior executives, technical team members, or external stakeholders? Each group has different priorities and levels of understanding.
Executive Summary for Decision-Makers
For executives, focus on the big picture. Include key milestones achieved, budget status, and any high-level risks or issues. I once worked on a project where the initial report was a deep dive into technical details.
It completely missed the mark with the VP, who just wanted to know if we were on track to meet the deadline and budget. Tailoring the executive summary to their needs saved a lot of time and kept them engaged.
It should provide a brief overview of the project’s progress, highlighting key achievements and potential roadblocks. Numerical data should be presented clearly and concisely, often using visual aids such as charts or graphs.
Detailed Updates for the Project Team
Your project team needs more granular information. Include task-level progress, dependencies, and any roadblocks they need to address. When I managed a software development project, our weekly team report included a section for each team member to update their progress and any challenges they faced.
This fostered transparency and helped us quickly identify and resolve issues. These updates should detail the status of each task, including any dependencies and potential roadblocks.
Providing a clear timeline and upcoming milestones helps keep the team aligned and focused.
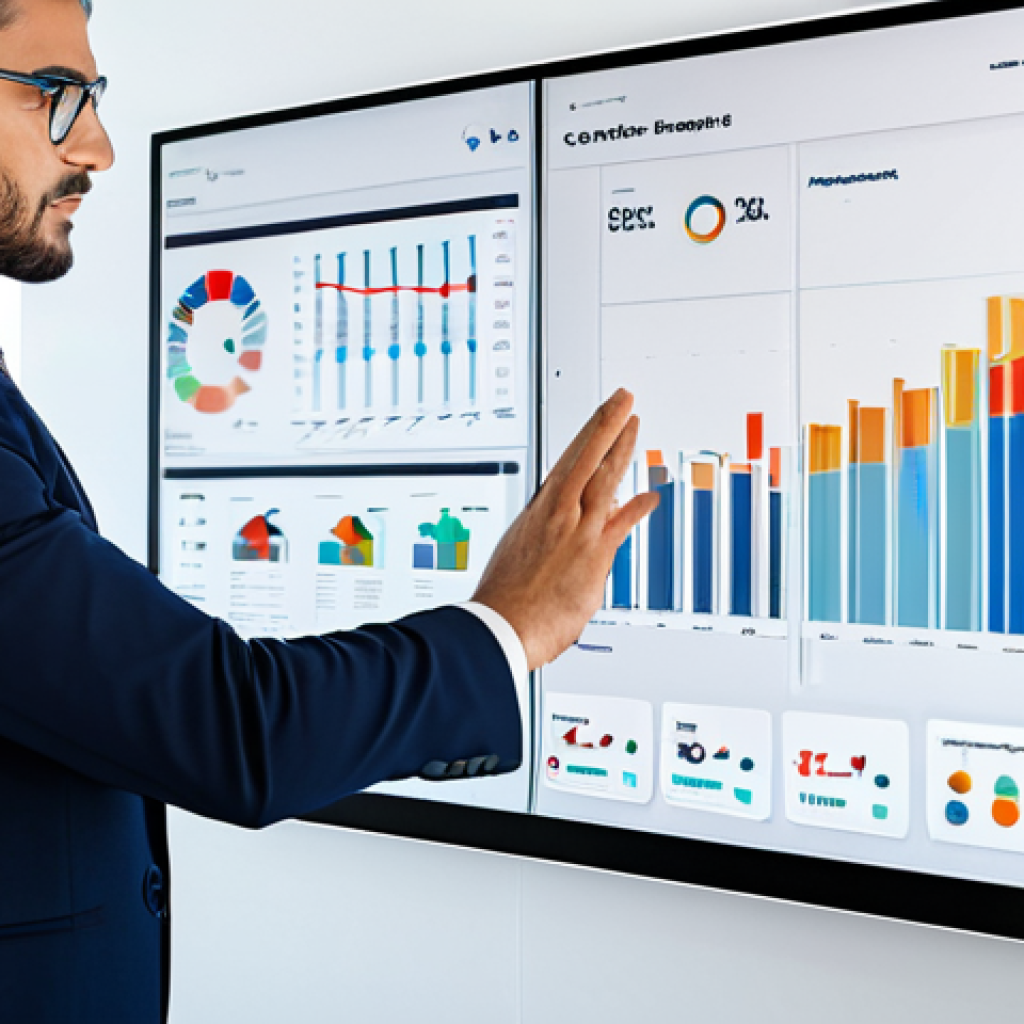
Visualizing Data for Impact
Data visualization is a powerful tool for communicating project information. A well-chosen chart or graph can convey complex information quickly and effectively.
Choosing the Right Visuals
Select visuals that best represent your data. Bar charts are great for comparing values, line graphs for showing trends over time, and pie charts for displaying proportions.
During a marketing campaign, we used a line graph to show how website traffic increased each week after launching a new ad campaign. The visual impact of the graph was far more effective than a table of numbers.
Moreover, heatmaps can be used to display risk assessments or resource allocation, providing a quick overview of critical areas.
Creating Clear and Concise Charts
Ensure your visuals are easy to understand. Label axes clearly, use appropriate scales, and avoid clutter. I’ve seen reports with overly complex charts that were more confusing than helpful.
Simplicity is key. Each visual should tell a story and be easily interpreted by the audience. Avoid using 3D charts or excessive colors, as these can often distort the data and make it harder to understand.
Highlighting Risks and Issues Proactively
Project management is all about anticipating and mitigating risks. Your report should clearly highlight any potential issues and the steps you’re taking to address them.
Early Identification of Potential Problems
Don’t wait for a problem to become a crisis before reporting it. Identify potential risks early and outline your mitigation plans. In a construction project I oversaw, we identified potential supply chain disruptions due to a new trade agreement.
By proactively seeking alternative suppliers, we were able to avoid significant delays. This proactive approach demonstrated foresight and helped maintain the project’s momentum.
Early identification can prevent minor issues from escalating into major crises.
Detailed Action Plans for Mitigation
For each identified risk, outline a clear action plan with specific steps, responsible parties, and timelines. I once received a report that listed several risks but didn’t explain how they would be addressed.
It left me wondering if anyone was actually taking responsibility for resolving them. Clear action plans show that you’re not just aware of the risks but actively working to mitigate them.
These plans should include contingency measures, alternative strategies, and regular monitoring to ensure effectiveness.
Using Storytelling to Engage Stakeholders
Data alone can be dry and uninspiring. Use storytelling techniques to bring your report to life and engage your audience.
Weaving a Narrative Around the Data
Connect the data to the project’s overall goals and impact. Explain how the project contributes to the organization’s strategic objectives. When reporting on a new product launch, we didn’t just present sales figures; we told the story of how the product addressed a customer need and improved their experience.
This made the report more compelling and memorable. Storytelling can transform mundane data into a captivating narrative, making the report more engaging and memorable.
Adding Human Elements and Anecdotes
Include anecdotes or quotes from team members or stakeholders to add a human touch to your report. Share success stories or lessons learned. In a report about a successful project turnaround, we included a quote from the project manager about the team’s dedication and resilience.
It reminded everyone that behind the numbers were real people working hard to achieve a common goal. Humanizing the report can foster a sense of connection and collaboration among stakeholders.
Leveraging Project Management Tools for Efficiency
Project management tools can streamline the reporting process and provide valuable insights.
Automating Data Collection and Analysis
Use project management software to automate data collection and analysis. This can save you time and reduce the risk of errors. I remember manually compiling data from multiple spreadsheets for a monthly report.
It was time-consuming and prone to errors. Switching to a project management tool with automated reporting capabilities was a game-changer. Automation tools can generate reports with real-time data, ensuring accuracy and timeliness.
Generating Customizable Reports
Choose a tool that allows you to customize reports to meet the specific needs of your audience. Some tools offer templates for different types of reports, which can save you even more time.
Being able to create custom reports ensures that the information is relevant and tailored to the specific needs of the audience. Customization options can include selecting specific data points, adding branding elements, and adjusting the level of detail.
Here’s a sample HTML table illustrating project status:
| Task | Status | Start Date | End Date | Assigned To |
|---|---|---|---|---|
| Develop Project Plan | Completed | 2024-01-15 | 2024-01-22 | John Doe |
| Conduct Market Research | In Progress | 2024-01-22 | 2024-02-05 | Jane Smith |
| Design Prototype | Pending | 2024-02-05 | 2024-02-19 | Peter Jones |
Adopting Agile Reporting Practices
Agile methodologies emphasize iterative development and continuous improvement. Agile reporting practices should reflect this approach.
Short, Frequent Updates
Replace lengthy, infrequent reports with short, frequent updates. Daily stand-up meetings, weekly sprint reviews, and quick status emails can keep stakeholders informed without overwhelming them.
We switched from monthly reports to weekly sprint reviews. It allowed us to address issues more quickly and keep everyone aligned on the project’s progress.
Short, frequent updates ensure that stakeholders are always informed and can provide timely feedback.
Focus on Value and Outcomes
Instead of simply reporting on tasks completed, focus on the value delivered and the outcomes achieved. Highlight how the project is contributing to the organization’s goals.
In our agile reports, we started including a section that described the business value of each completed feature. It helped stakeholders understand the impact of our work and stay engaged.
Emphasizing value and outcomes helps stakeholders understand the tangible benefits of the project and its impact on the organization’s goals.
The Future of Project Management Reporting: AI Integration
AI-powered tools are poised to transform project management reporting by automating tasks, providing insights, and improving decision-making.
AI-Driven Data Analysis
AI can analyze vast amounts of project data to identify trends, patterns, and potential risks. This can help project managers make more informed decisions and proactively address issues.
I’m excited about the potential of AI to analyze historical project data and predict future performance. Imagine having a tool that can identify projects at risk of failure before they even start.
AI-driven data analysis can provide project managers with predictive insights, allowing them to anticipate and mitigate potential issues before they escalate.
Automated Report Generation
AI can automate the process of generating reports, saving project managers time and effort. These tools can pull data from multiple sources, create visualizations, and generate written summaries.
I’ve seen demos of AI tools that can generate a project status report in minutes. It’s incredible how much time this can save, allowing project managers to focus on more strategic tasks.
Automated report generation can significantly reduce the time and effort required to create reports, freeing up project managers to focus on more strategic tasks.
Crafting project management reports that actually get read and acted upon is a skill many PMs strive for. It’s about more than just listing tasks and deadlines; it’s about painting a picture of progress, challenges, and future directions.
Over the years, I’ve learned that a good report isn’t just informative—it’s engaging and tailored to its audience.
Tailoring Your Report to the Audience
Understanding who will be reading your report is paramount. Are they senior executives, technical team members, or external stakeholders? Each group has different priorities and levels of understanding.
Executive Summary for Decision-Makers
For executives, focus on the big picture. Include key milestones achieved, budget status, and any high-level risks or issues. I once worked on a project where the initial report was a deep dive into technical details. It completely missed the mark with the VP, who just wanted to know if we were on track to meet the deadline and budget. Tailoring the executive summary to their needs saved a lot of time and kept them engaged. It should provide a brief overview of the project’s progress, highlighting key achievements and potential roadblocks. Numerical data should be presented clearly and concisely, often using visual aids such as charts or graphs.
Detailed Updates for the Project Team
Your project team needs more granular information. Include task-level progress, dependencies, and any roadblocks they need to address. When I managed a software development project, our weekly team report included a section for each team member to update their progress and any challenges they faced. This fostered transparency and helped us quickly identify and resolve issues. These updates should detail the status of each task, including any dependencies and potential roadblocks. Providing a clear timeline and upcoming milestones helps keep the team aligned and focused.
Visualizing Data for Impact
Data visualization is a powerful tool for communicating project information. A well-chosen chart or graph can convey complex information quickly and effectively.
Choosing the Right Visuals
Select visuals that best represent your data. Bar charts are great for comparing values, line graphs for showing trends over time, and pie charts for displaying proportions. During a marketing campaign, we used a line graph to show how website traffic increased each week after launching a new ad campaign. The visual impact of the graph was far more effective than a table of numbers. Moreover, heatmaps can be used to display risk assessments or resource allocation, providing a quick overview of critical areas.
Creating Clear and Concise Charts
Ensure your visuals are easy to understand. Label axes clearly, use appropriate scales, and avoid clutter. I’ve seen reports with overly complex charts that were more confusing than helpful. Simplicity is key. Each visual should tell a story and be easily interpreted by the audience. Avoid using 3D charts or excessive colors, as these can often distort the data and make it harder to understand.
Highlighting Risks and Issues Proactively
Project management is all about anticipating and mitigating risks. Your report should clearly highlight any potential issues and the steps you’re taking to address them.
Early Identification of Potential Problems
Don’t wait for a problem to become a crisis before reporting it. Identify potential risks early and outline your mitigation plans. In a construction project I oversaw, we identified potential supply chain disruptions due to a new trade agreement. By proactively seeking alternative suppliers, we were able to avoid significant delays. This proactive approach demonstrated foresight and helped maintain the project’s momentum. Early identification can prevent minor issues from escalating into major crises.
Detailed Action Plans for Mitigation
For each identified risk, outline a clear action plan with specific steps, responsible parties, and timelines. I once received a report that listed several risks but didn’t explain how they would be addressed. It left me wondering if anyone was actually taking responsibility for resolving them. Clear action plans show that you’re not just aware of the risks but actively working to mitigate them. These plans should include contingency measures, alternative strategies, and regular monitoring to ensure effectiveness.
Using Storytelling to Engage Stakeholders
Data alone can be dry and uninspiring. Use storytelling techniques to bring your report to life and engage your audience.
Weaving a Narrative Around the Data
Connect the data to the project’s overall goals and impact. Explain how the project contributes to the organization’s strategic objectives. When reporting on a new product launch, we didn’t just present sales figures; we told the story of how the product addressed a customer need and improved their experience. This made the report more compelling and memorable. Storytelling can transform mundane data into a captivating narrative, making the report more engaging and memorable.
Adding Human Elements and Anecdotes
Include anecdotes or quotes from team members or stakeholders to add a human touch to your report. Share success stories or lessons learned. In a report about a successful project turnaround, we included a quote from the project manager about the team’s dedication and resilience. It reminded everyone that behind the numbers were real people working hard to achieve a common goal. Humanizing the report can foster a sense of connection and collaboration among stakeholders.
Leveraging Project Management Tools for Efficiency
Project management tools can streamline the reporting process and provide valuable insights.
Automating Data Collection and Analysis
Use project management software to automate data collection and analysis. This can save you time and reduce the risk of errors. I remember manually compiling data from multiple spreadsheets for a monthly report. It was time-consuming and prone to errors. Switching to a project management tool with automated reporting capabilities was a game-changer. Automation tools can generate reports with real-time data, ensuring accuracy and timeliness.
Generating Customizable Reports
Choose a tool that allows you to customize reports to meet the specific needs of your audience. Some tools offer templates for different types of reports, which can save you even more time. Being able to create custom reports ensures that the information is relevant and tailored to the specific needs of the audience. Customization options can include selecting specific data points, adding branding elements, and adjusting the level of detail.
Here’s a sample HTML table illustrating project status:
| Task | Status | Start Date | End Date | Assigned To |
|---|---|---|---|---|
| Develop Project Plan | Completed | 2024-01-15 | 2024-01-22 | John Doe |
| Conduct Market Research | In Progress | 2024-01-22 | 2024-02-05 | Jane Smith |
| Design Prototype | Pending | 2024-02-05 | 2024-02-19 | Peter Jones |
Adopting Agile Reporting Practices
Agile methodologies emphasize iterative development and continuous improvement. Agile reporting practices should reflect this approach.
Short, Frequent Updates
Replace lengthy, infrequent reports with short, frequent updates. Daily stand-up meetings, weekly sprint reviews, and quick status emails can keep stakeholders informed without overwhelming them. We switched from monthly reports to weekly sprint reviews. It allowed us to address issues more quickly and keep everyone aligned on the project’s progress. Short, frequent updates ensure that stakeholders are always informed and can provide timely feedback.
Focus on Value and Outcomes
Instead of simply reporting on tasks completed, focus on the value delivered and the outcomes achieved. Highlight how the project is contributing to the organization’s goals. In our agile reports, we started including a section that described the business value of each completed feature. It helped stakeholders understand the impact of our work and stay engaged. Emphasizing value and outcomes helps stakeholders understand the tangible benefits of the project and its impact on the organization’s goals.
The Future of Project Management Reporting: AI Integration
AI-powered tools are poised to transform project management reporting by automating tasks, providing insights, and improving decision-making.
AI-Driven Data Analysis
AI can analyze vast amounts of project data to identify trends, patterns, and potential risks. This can help project managers make more informed decisions and proactively address issues. I’m excited about the potential of AI to analyze historical project data and predict future performance. Imagine having a tool that can identify projects at risk of failure before they even start. AI-driven data analysis can provide project managers with predictive insights, allowing them to anticipate and mitigate potential issues before they escalate.
Automated Report Generation
AI can automate the process of generating reports, saving project managers time and effort. These tools can pull data from multiple sources, create visualizations, and generate written summaries. I’ve seen demos of AI tools that can generate a project status report in minutes. It’s incredible how much time this can save, allowing project managers to focus on more strategic tasks. Automated report generation can significantly reduce the time and effort required to create reports, freeing up project managers to focus on more strategic tasks.
Wrapping Up
Effective project management reporting is a blend of art and science. By understanding your audience, visualizing data effectively, and leveraging technology, you can create reports that drive action and deliver results. Embrace these strategies, and watch your project success rates soar! Remember, a great report is a story well told.
Useful Tips
1. Always define your audience before writing the report; tailor the content to their needs.
2. Use visual aids like charts and graphs to make complex data easier to understand.
3. Proactively highlight risks and issues to allow for timely mitigation.
4. Integrate project management tools to automate data collection and report generation.
5. Focus on value and outcomes in agile reports to demonstrate the project’s impact.
Key Takeaways
Creating effective project management reports requires understanding your audience, visualizing data clearly, and using technology to automate processes. Proactive risk management and storytelling also play a crucial role in engaging stakeholders and driving action.
Frequently Asked Questions (FAQ) 📖
Q: What are the biggest challenges in creating effective project management reports, and how can they be overcome?
A: Honestly, one of the biggest headaches is sifting through tons of data and making it understandable for everyone. Not everyone is a numbers person, right?
I’ve found that the trick is to focus on the “so what.” Instead of just dumping data, highlight the key insights and explain why they matter to the project’s goals.
Visuals like charts and graphs are your best friends here. Also, tailor your language to the audience. The CEO doesn’t need the same level of technical detail as the development team.
Another challenge? Keeping things concise. No one wants to read a novel!
Aim for clarity and brevity, hitting the essential points.
Q: How can
A: I tools genuinely improve project management reporting, beyond just automation? What are some practical examples? A2: Okay, so AI isn’t just about making reports faster; it’s about making them smarter.
Think about it: AI can analyze historical data to predict potential risks or delays, giving you a heads-up before they derail the project. I saw this firsthand on a construction project where an AI tool flagged potential supply chain issues based on weather patterns and supplier performance.
It allowed us to proactively find alternative suppliers and avoid a costly delay. Also, AI can personalize reports based on stakeholder needs, automatically highlighting the information each person cares about most.
It’s like having a custom report generator that understands everyone’s priorities. And let’s not forget natural language generation (NLG) – AI writing summaries and narratives in plain English, making it easier for everyone to grasp the project’s status.
Q: How do you balance the need for data-driven reporting with the importance of storytelling in project management?
A: This is a crucial balance! Data provides the foundation, but storytelling brings it to life. Imagine presenting a report with just numbers – it’s dry and hard to connect with.
But if you weave those numbers into a narrative, it becomes much more compelling. For example, instead of just saying “Team A exceeded their target by 15%,” you could say, “Thanks to Team A’s innovative approach and relentless effort, they not only met their target but smashed it by 15%, directly contributing to a two-week acceleration in the project timeline.” See the difference?
You’re highlighting the impact and acknowledging the human element. Always remember to connect the data points back to the project’s overall goals and the people involved.
Stories create buy-in and motivate the team!
📚 References
Wikipedia Encyclopedia
구글 검색 결과
구글 검색 결과
구글 검색 결과
구글 검색 결과
구글 검색 결과